
On 6 August 2026, the European Association for Business and Commerce hosted a briefing in Bangkok with the National Economic and Social Development Council on Thailand’s economic outlook. We attended. What follows is our reading of what was presented — and, more usefully for anyone running a business here, what it changes about how you plan.
The short version: Thailand is not in a downturn. It is in a different growth regime. And the commercial responses that worked in the last regime will not work in this one.
Growth has structurally downshifted
The number most people will take away is around 2%. The more important number is the trend behind it.
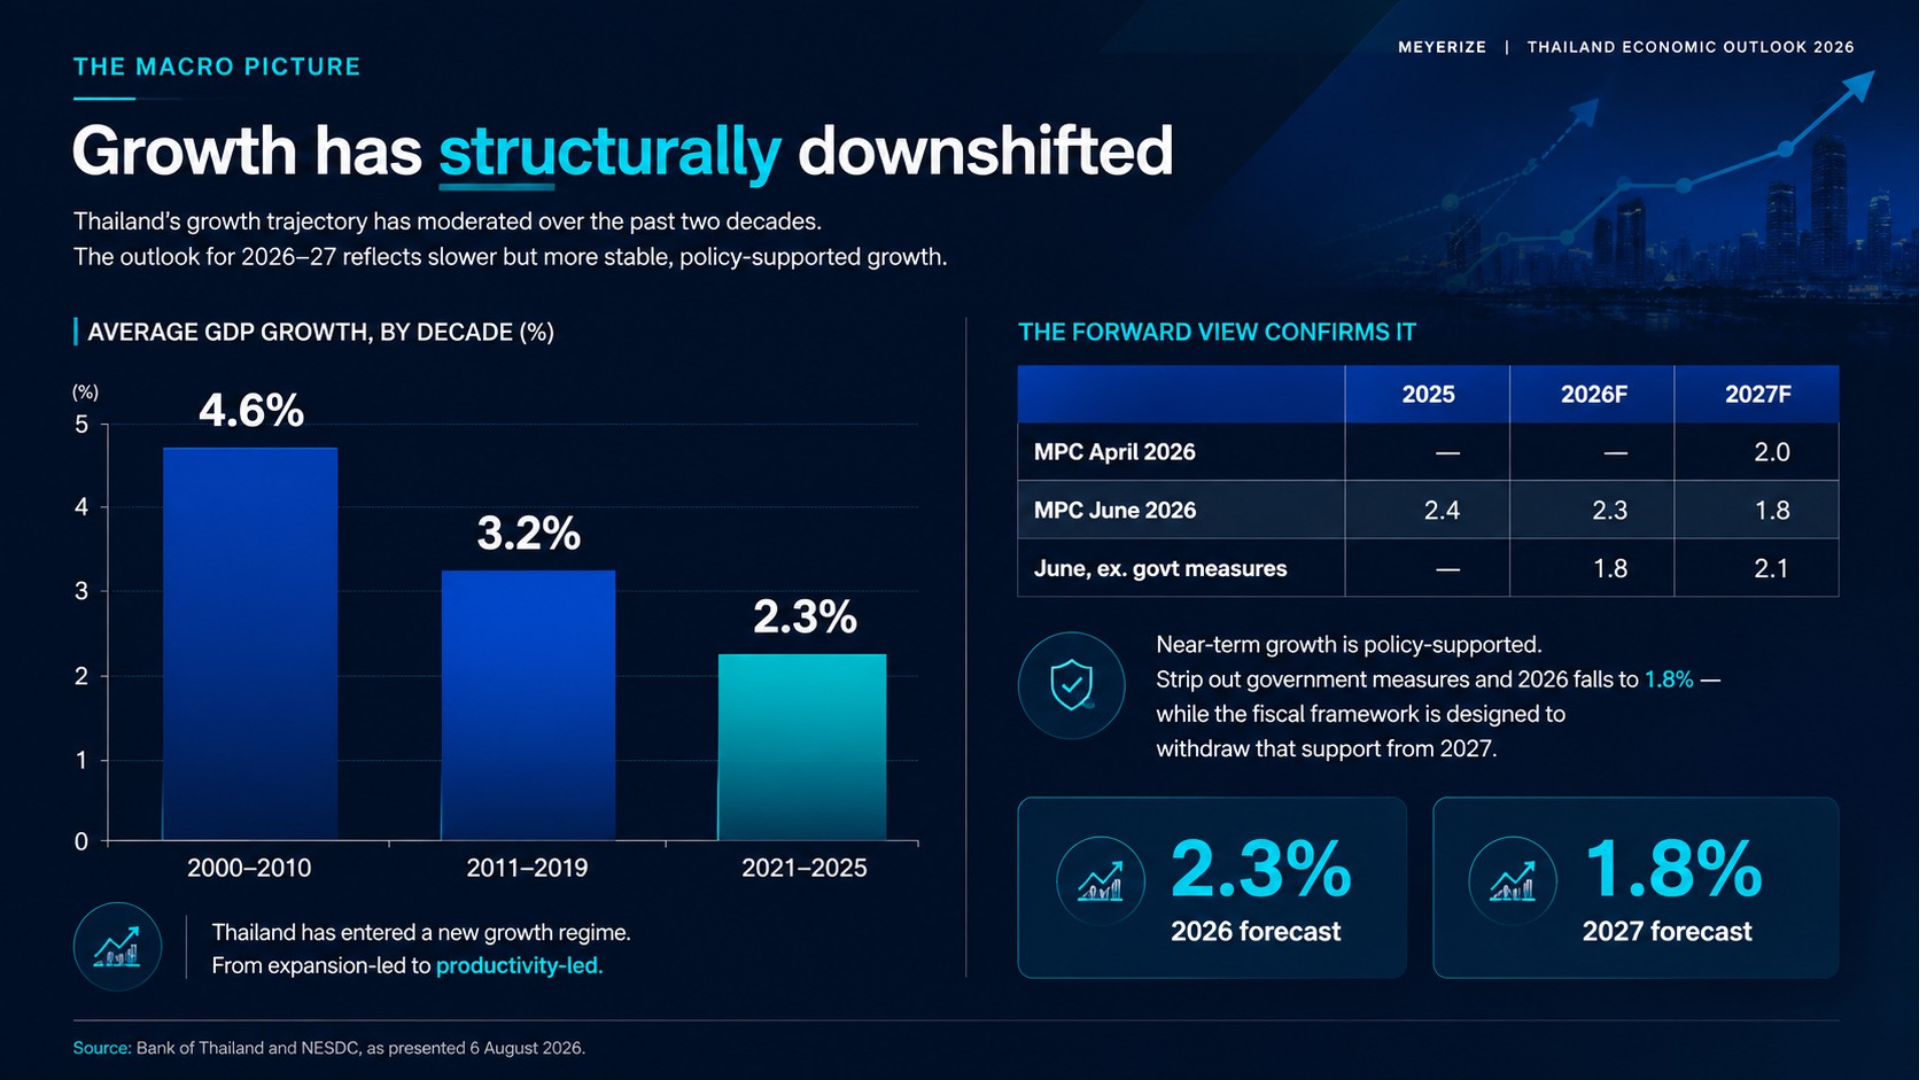
Thai GDP growth averaged 4.6% across 2000–2010. It averaged 3.2% across 2011–2019. Across 2021–2025 it averaged 2.3%. The forward view does not contest that trajectory — it confirms it. The Bank of Thailand’s June 2026 round puts 2026 at 2.3% and 2027 at 1.8%.
Strip out government measures and the picture is starker. On the same June round, underlying 2026 growth falls to 1.8% — and the fiscal framework is explicitly designed to withdraw that support from 2027 onward.
This is not a cyclical dip waiting for a rebound. It is a structural shift from expansion-led growth to productivity-led growth. For business leaders, the practical consequence is that top-line growth has to come from share capture, from positioning in the segments still growing, and from cost structure. It will not come from a recovering consumer.
Inflation is not the binding constraint
It is worth being clear about what is not the problem, because misdiagnosing this leads to the wrong pricing decisions.
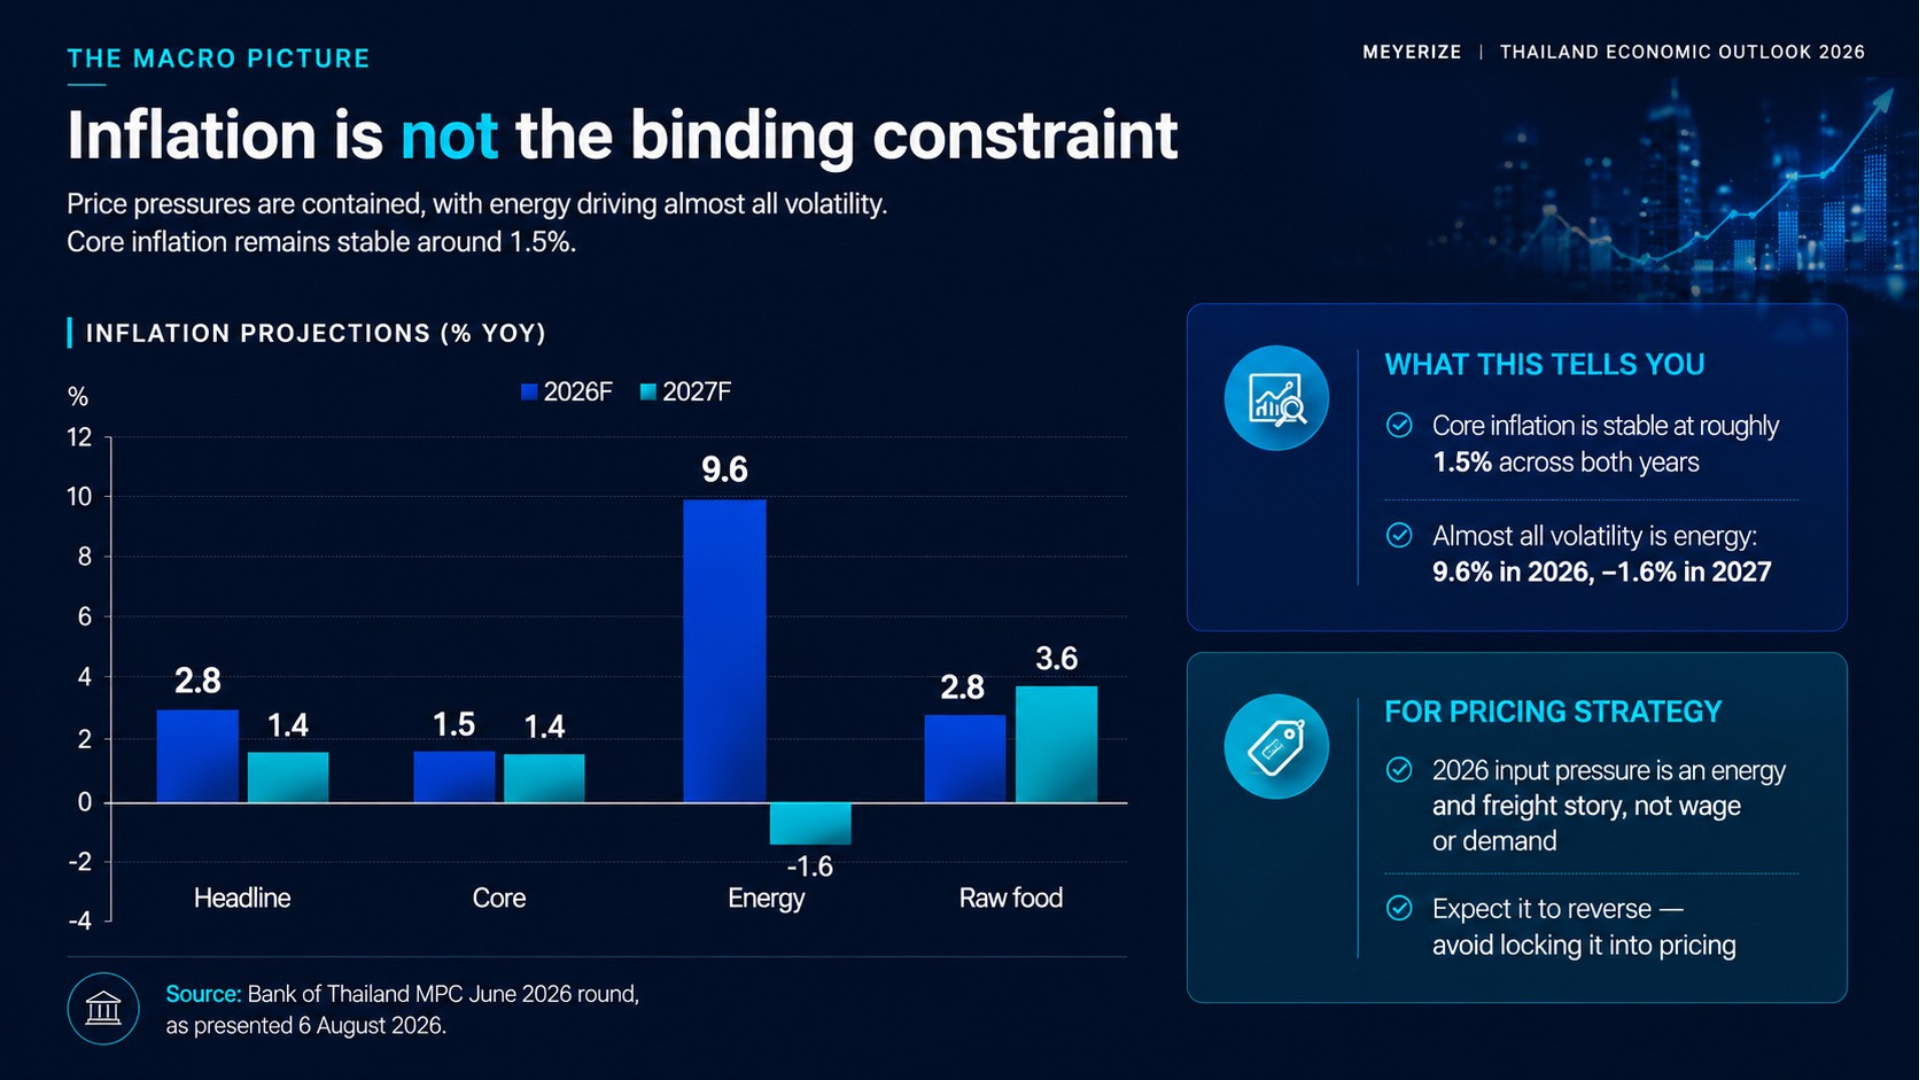
Headline inflation is forecast at 2.8% in 2026 and 1.4% in 2027. Core inflation sits at 1.5% and 1.4% — stable across both years. Almost all the volatility is energy: 9.6% in 2026, then −1.6% in 2027.
The read-through for pricing strategy is direct. The 2026 input pressure is an energy and freight story, not a wage or demand story, and it is expected to reverse. Locking a transient cost spike into a price list is an easy mistake to make in the first half of a year like this one.
Constraint 1: Fiscal consolidation closes the stimulus window
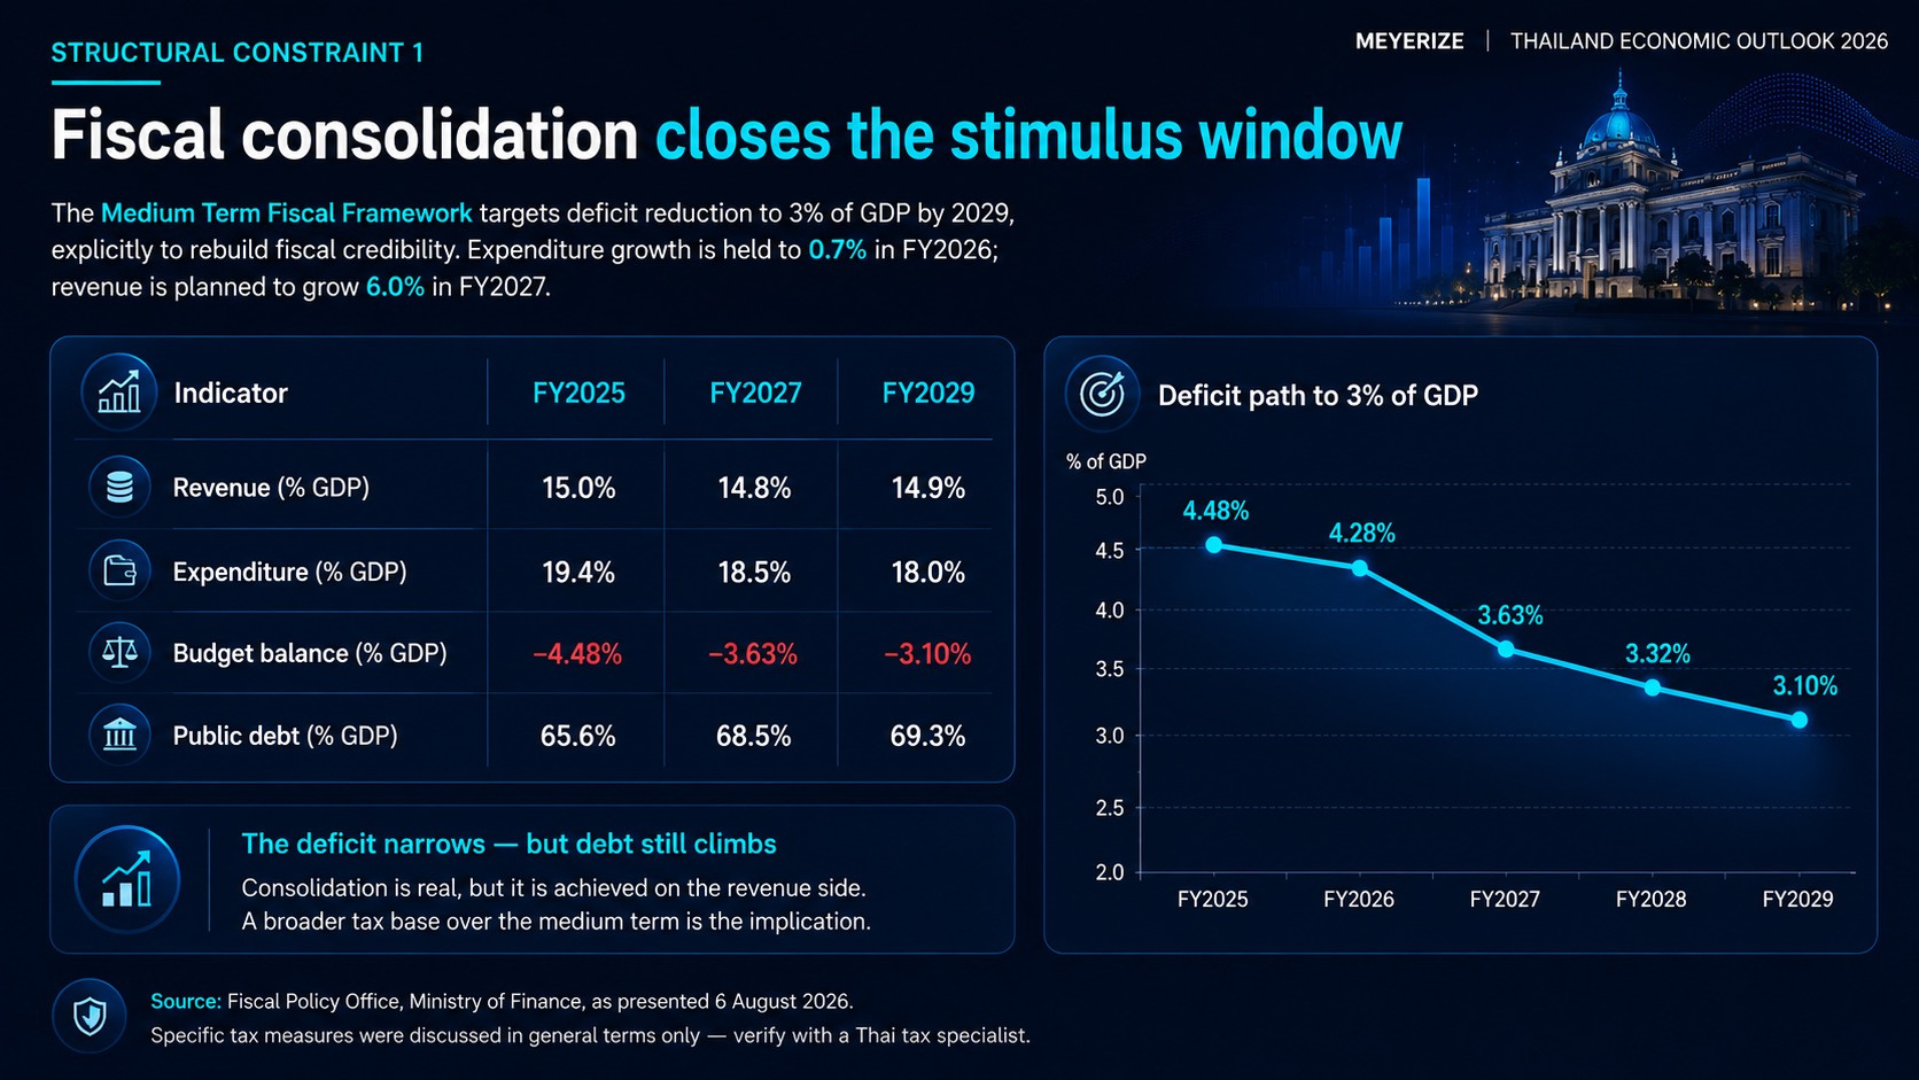
The Medium Term Fiscal Framework targets deficit reduction to 3% of GDP by 2029, explicitly to rebuild fiscal credibility. Expenditure growth is held to 0.7% in FY2026. Revenue is planned to grow 6.0% in FY2027.
The deficit path runs from 4.48% of GDP in FY2025 to 3.10% in FY2029. But public debt still climbs across the same window — from 65.6% of GDP in FY2025 to 69.3% in FY2029.
Read the mechanics rather than the headline. Consolidation is real, but it is being achieved on the revenue side. A broader tax base over the medium term is the implication. Specific measures were discussed only in general terms, and anyone modelling this into a Thailand plan should verify with a Thai tax specialist rather than working from a briefing summary.
Constraint 2: Energy imports are the principal external risk
Thai energy imports were 7.39% of GDP in 2025. If Brent averages USD 80 per barrel, that reaches roughly 10% of GDP in 2026 — a swing of about 2.6 percentage points of national income transferred offshore. It is the largest single swing factor in the external accounts.
The stated policy response has a sequence to it that is worth noting: move away from imported fossil fuel toward domestic renewable generation, but upgrade the grid first. Grid modernisation was described as the precondition for transition rather than its consequence. That is a sequence requiring careful execution rather than acceleration — and it means the energy cost exposure sitting in your operating model is not a short-term problem.
Constraint 3: Demographics already subtract from growth
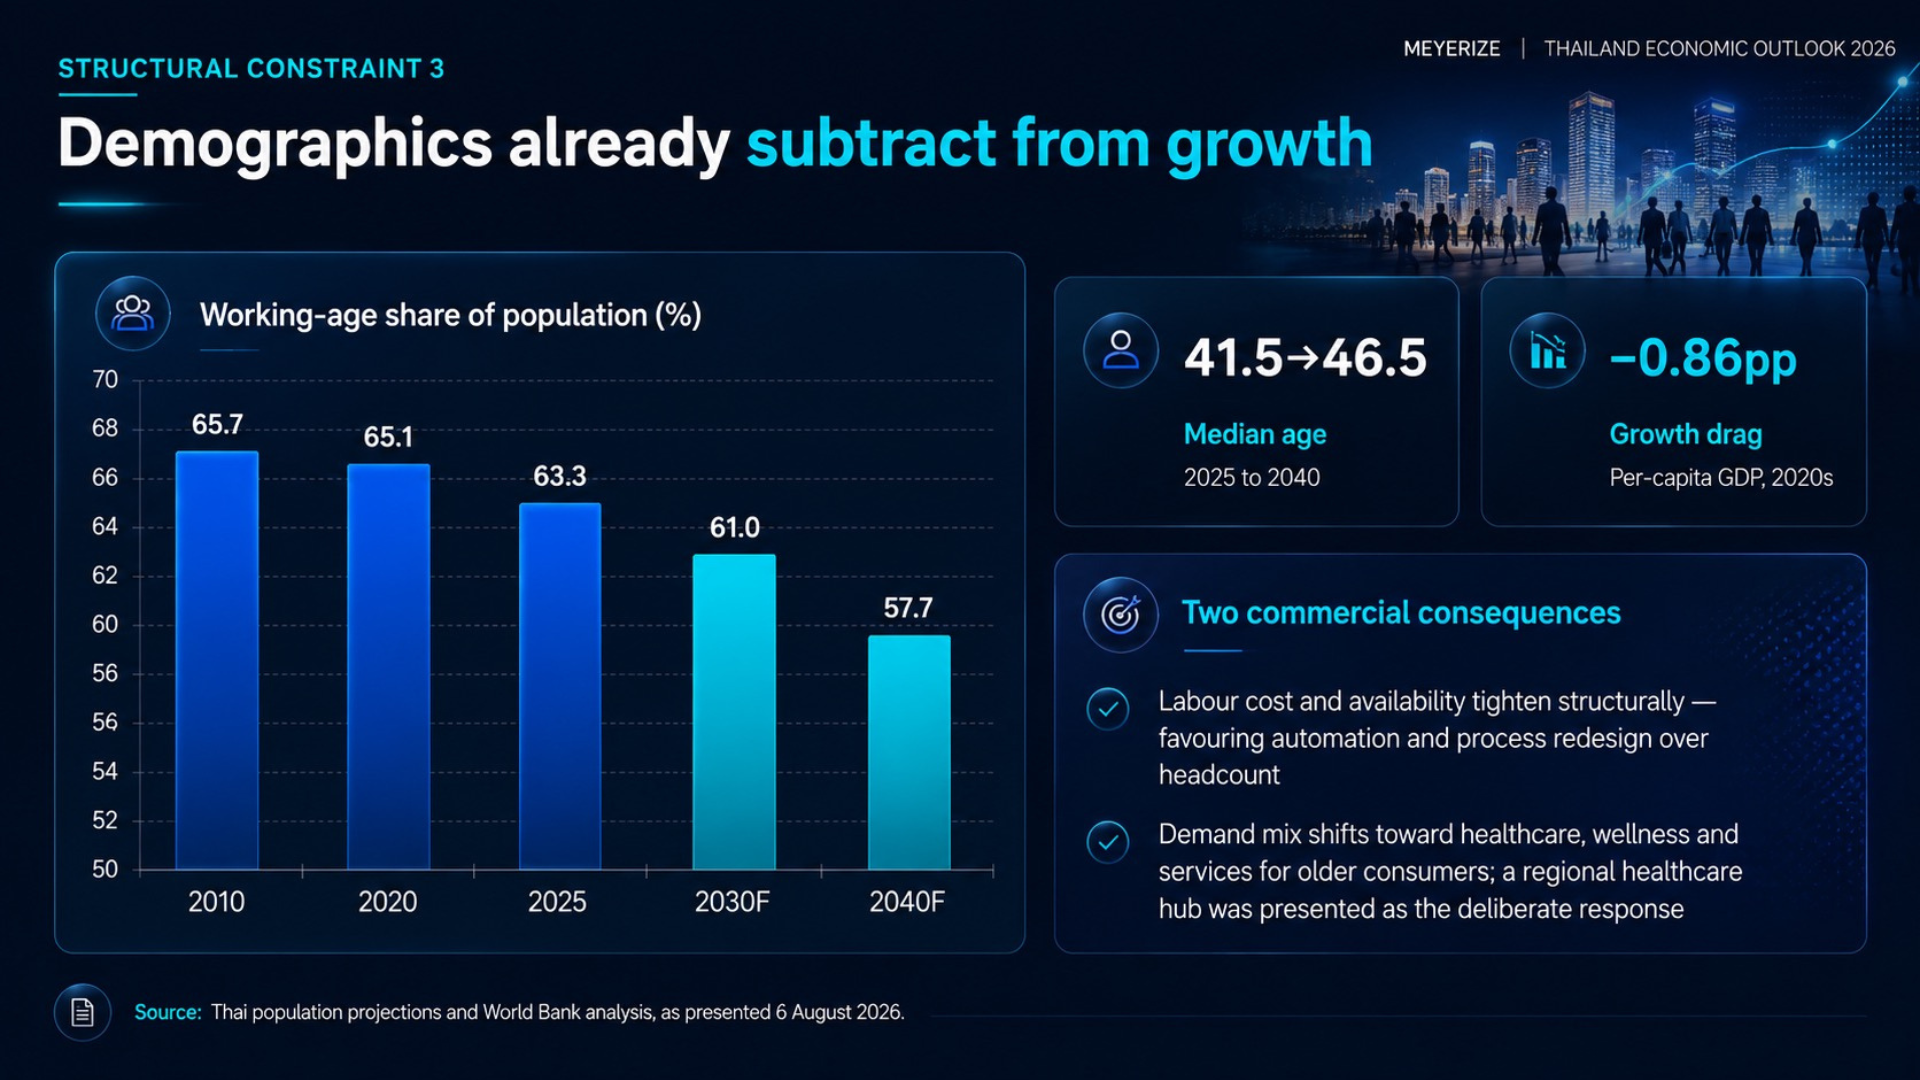
The working-age share of Thailand’s population was 65.7% in 2010 and 63.3% in 2025. It is projected at 61.0% by 2030 and 57.7% by 2040. Median age moves from 41.5 to 46.5 between 2025 and 2040. The estimated drag on per-capita GDP growth through the 2020s is −0.86 percentage points.
Two commercial consequences follow. Labour cost and availability tighten structurally, which favours automation and process redesign over headcount. And the demand mix shifts toward healthcare, wellness and services for older consumers — a regional healthcare hub was presented as the deliberate policy response.
If your Thailand operating model assumes you can solve a capacity problem by hiring, that assumption has a shelf life.
Constraint 4: Credit is not reaching smaller businesses
This is the finding with the most immediate operational consequence, and it is the one least likely to show up in a market-entry deck.
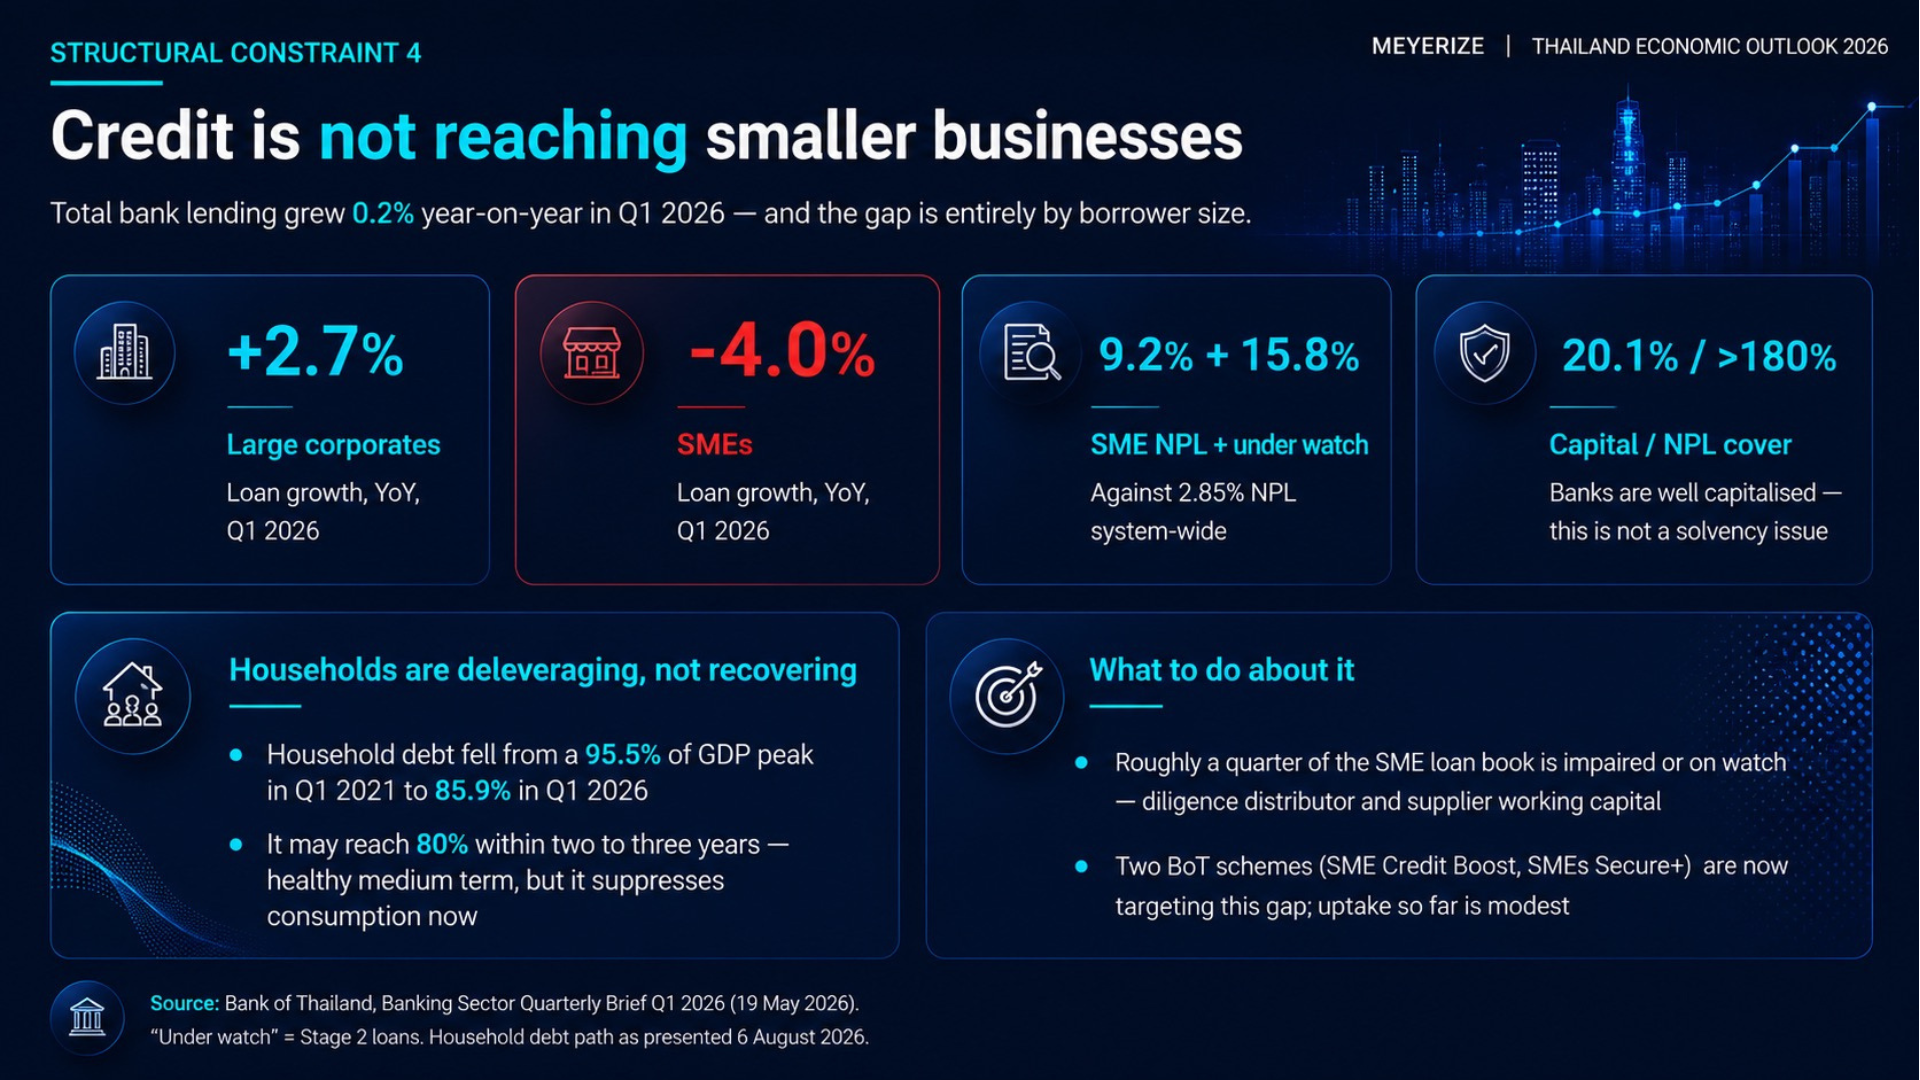
Total bank lending grew 0.2% year-on-year in Q1 2026. The gap underneath that number is entirely by borrower size: large corporates grew 2.7%; SME lending contracted 4.0%.
SME asset quality shows 9.2% non-performing against 15.8% more under watch — set against a system-wide NPL rate of 2.85%. Roughly a quarter of the SME loan book is impaired or on watch. This is not a solvency issue for the banking system; banks are well capitalised, with NPL cover above 180%. It is a working-capital problem concentrated in exactly the layer of the economy where most foreign entrants find their distributors, suppliers and local partners.
Households are deleveraging rather than recovering. Household debt has fallen from a peak of 95.5% of GDP in Q1 2021 to 85.9% in Q1 2026, and may reach 80% within two to three years. Healthy over the medium term. Suppressive of consumption now.
Two Bank of Thailand schemes — SME Credit Boost and SMEs Secure+ — are targeting the gap. Uptake so far is modest.
Constraint 5: US trade exposure remains unresolved
Roughly 12% of Thai GDP is exported to the United States, the largest single export market, and the trade relationship remains unsettled. Section 301 exposure was named directly as open.
Regional industrial overcapacity compounds it, creating diversion pressure into Thailand and neighbouring markets. The companies most exposed are those with US-bound flows routed through Thailand, or with China-origin inputs entering Thai production.
The practical implication is a change in how origin work should be treated. Origin determination, tariff classification and free trade agreement eligibility are not one-time setup tasks. They need periodic re-verification, with origin documentation and supplier certification current enough to withstand scrutiny.
Where growth actually is
A 2% national number is an average, not a description. Three segments are running well above it.
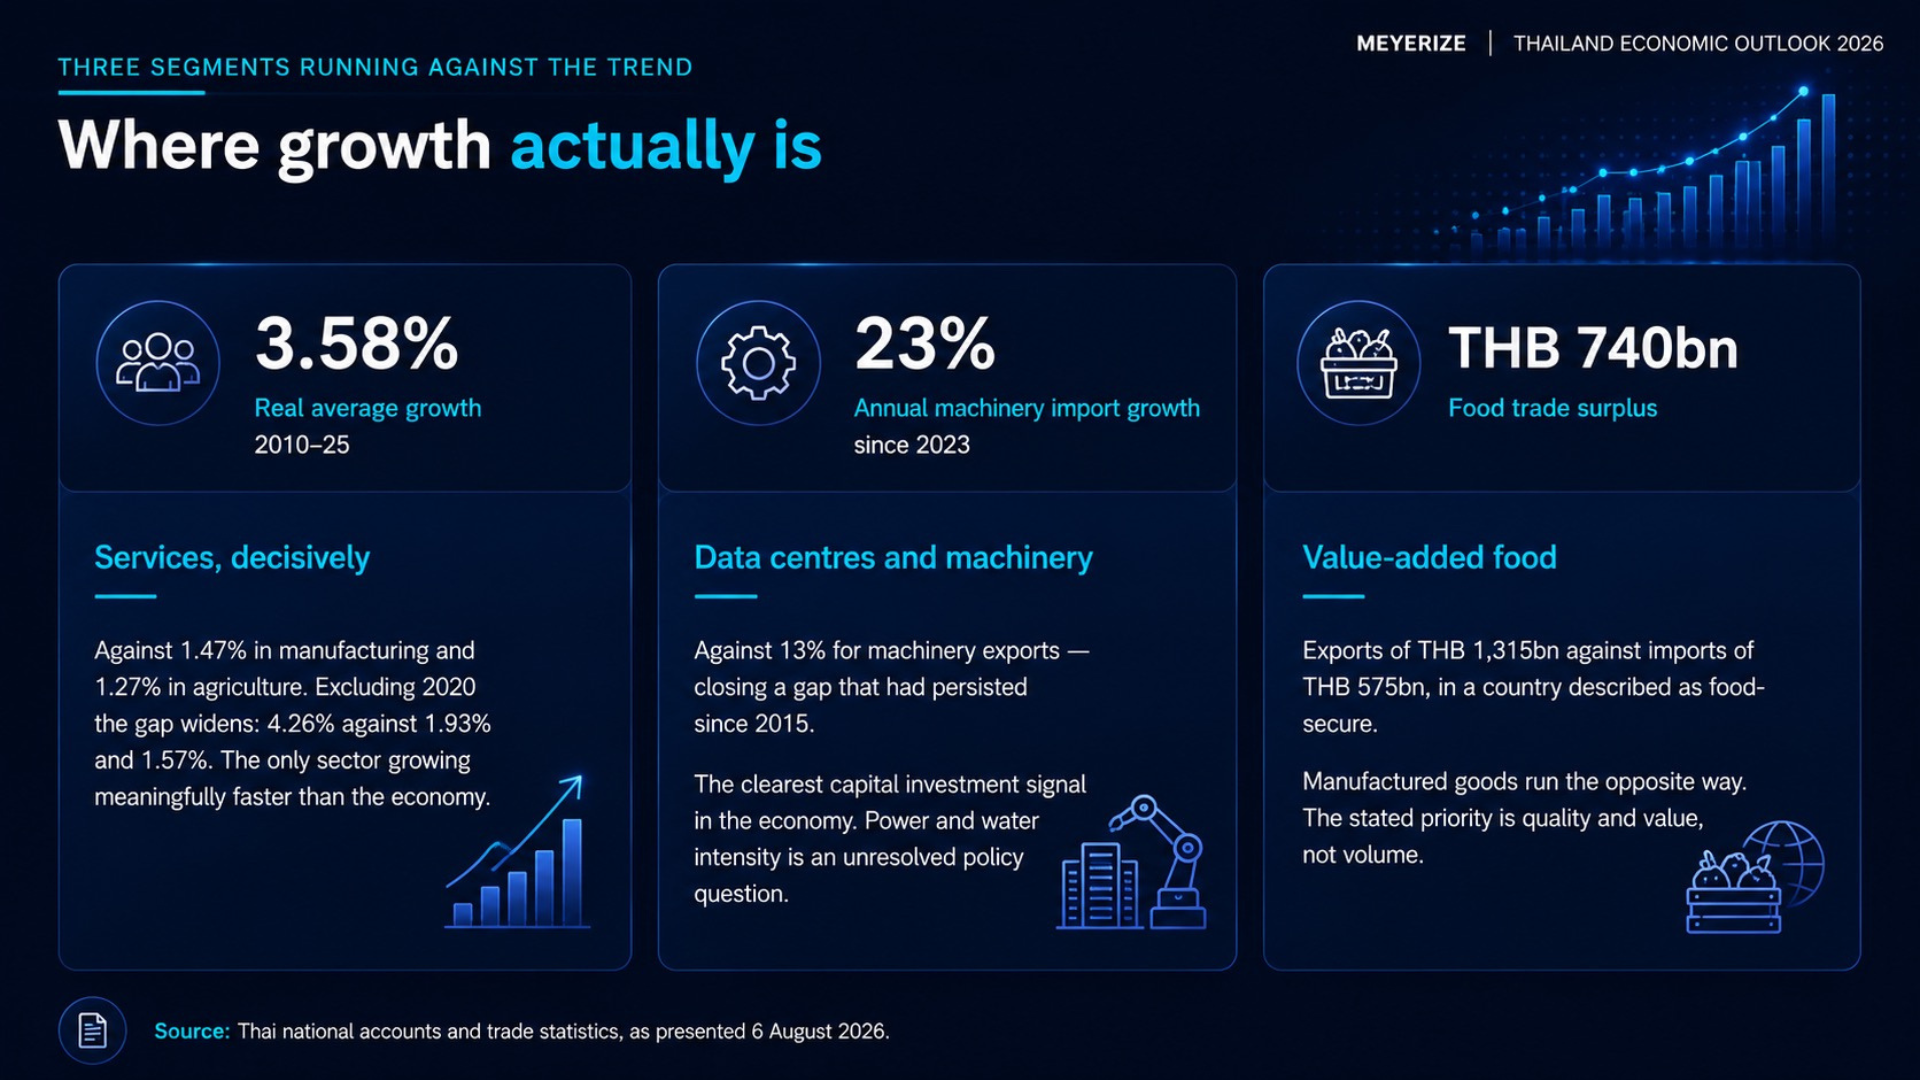
Services, decisively. Real average growth of 3.58% across 2010–2025, against 1.47% in manufacturing and 1.27% in agriculture. Excluding 2020 the gap widens further — 4.26% against 1.93% and 1.57%. It is the only sector growing meaningfully faster than the economy.
Data centres and machinery investment. Machinery imports have grown 23% annually since 2023, against 13% for machinery exports — closing a gap that had persisted since 2015. This is the clearest capital investment signal in the economy. The power and water intensity of that investment remains an unresolved policy question.
Value-added food. A food trade surplus of THB 740 billion, on exports of THB 1,315 billion against imports of THB 575 billion. Manufactured goods run the opposite way. The stated national priority is quality and value, not volume.
What this means commercially
Five conclusions we would draw for anyone entering, operating or investing in Thailand over the next eighteen months.
Growth must be engineered, not assumed. In a 2% economy with no credit expansion, margin comes from cost structure, process efficiency and pricing discipline — not volume. Continuous improvement, and freight, duty and landed-cost optimisation, move from optional to material.
Build demand cases off deleveraging households. Stress-test consumer-facing entry plans against a flat-to-slow demand scenario. Treat the growth case as upside rather than base.
Position into services, investment-linked demand and premium food. These are the segments growing faster than the economy. Machinery and project cargo flows tied to data-centre investment are a growth pocket inside an otherwise flat trade market.
Treat trade and origin risk as live. With US-bound exports worth roughly 12% of GDP, origin determination, classification and FTA eligibility warrant periodic re-verification.
Diligence local counterparty working capital. With SME lending contracting 4.0% and roughly a quarter of the SME book impaired or on watch, distributor, supplier and partner financial resilience is a genuine execution risk — not a procurement formality.
What to watch
Six indicators that would materially change the picture:
- Brent crude against USD 80/bbl — the swing factor in the external position and domestic energy cost.
- US trade position and Section 301 — any development affecting Thai-routed or Thai-processed goods.
- Uptake of the BoT SME schemes — the earliest credible signal of domestic demand recovery.
- FY2027 revenue measures — given the planned 6.0% revenue increase and the deficit path to 3% of GDP by 2029.
- Data-centre approval conditions — utility and resource conditions attached to approvals, and the pace of grid modernisation.
- EU–Thailand negotiation progress — would materially change market access economics in both directions.
Basis of preparation
This briefing records observations from a single public briefing and the discussion that followed. Figures are drawn from the Bank of Thailand, the Fiscal Policy Office of the Ministry of Finance, the World Bank and Thai national accounts, as presented by the speaker. They have not been independently reconciled against source publications, and forecasts are the forecaster’s.
Nothing here constitutes tax, legal or regulatory advice. Duty rates, tariff classification, origin eligibility and product approval requirements are product-specific and change. They should be verified with a qualified local specialist before any commercial or compliance decision.
Download the full briefing
The complete thirteen-page briefing, including the underlying charts and data tables, is available as a PDF.
Planning a Thailand move in this environment?
Meyerize works with companies entering, operating and transforming across Southeast Asia — connecting commercial ambition to the supply chains, partners, capabilities and controls required to deliver it. That includes operational assessment, capability development, supply chain and warehouse design, and product- and lane-specific verification of duty, origin and FTA eligibility.
If a 2% economy has changed the arithmetic on a plan you are already working on, we are happy to look at it with you.
Before you commit to a market
Our Southeast Asia Market Entry Readiness Checklist works through 28 questions across seven areas — demand validation, landed cost, operating model, compliance, partners, capability and post-launch control. It takes about ten minutes and gives you a scored readiness view.
Meyerize publishes periodic reads on the economic and regulatory conditions shaping commercial decisions across Southeast Asia.